Use the Chrome DevTools to debug a Node.js app
New Courses Coming Soon
Join the waiting lists
When we're programming it's common to have the need to quickly test and do some experiments with a piece of code.
With client-side code it’s easy to start debugging some piece of code - just open the Chrome DevTools on any page, and start writing client-side JavaScript.
How can we do the same with Node.js code, and debug Node modules with access to the filesystem and other Node.js capabilities? It’s very simple, actually.
Open your terminal and run
node --inspect

Then in Chrome type this URL: about://inspect.
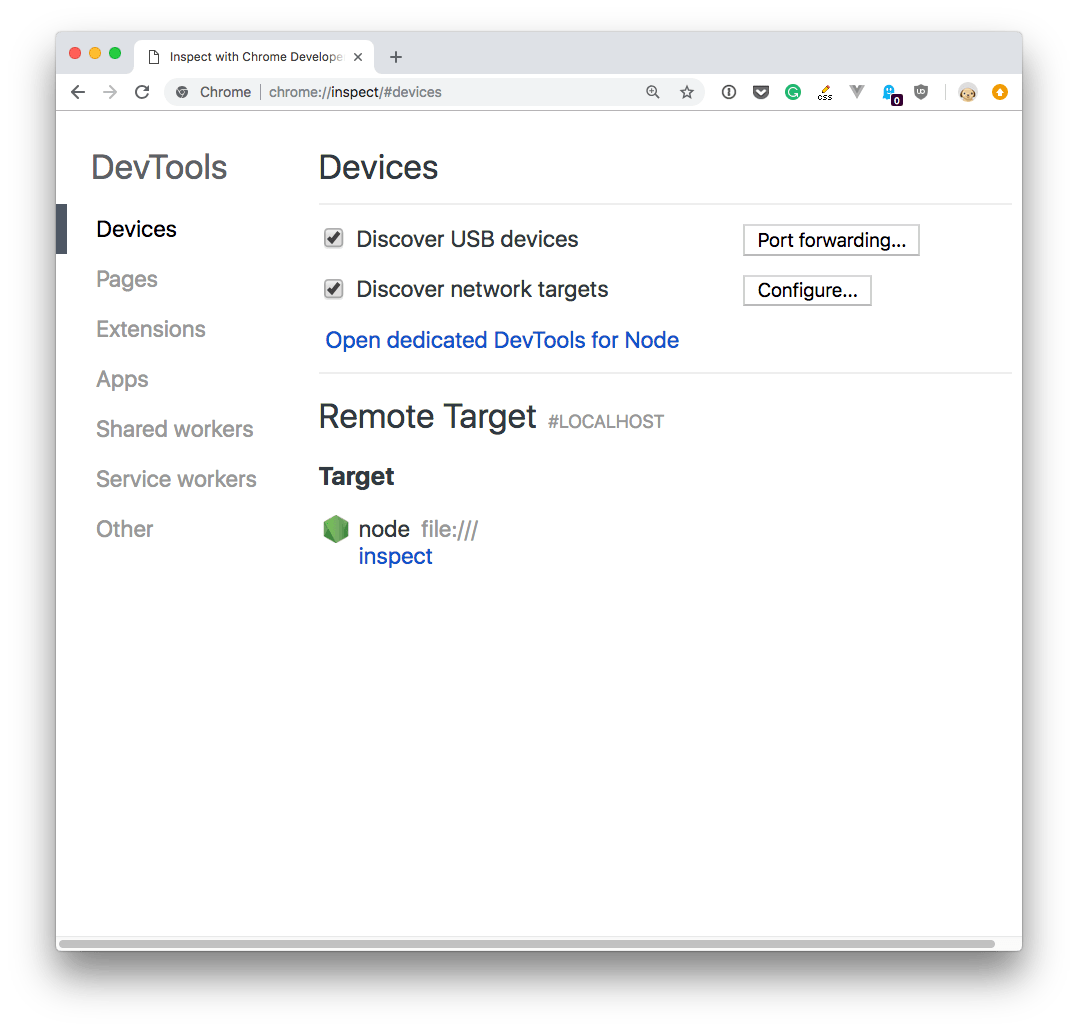
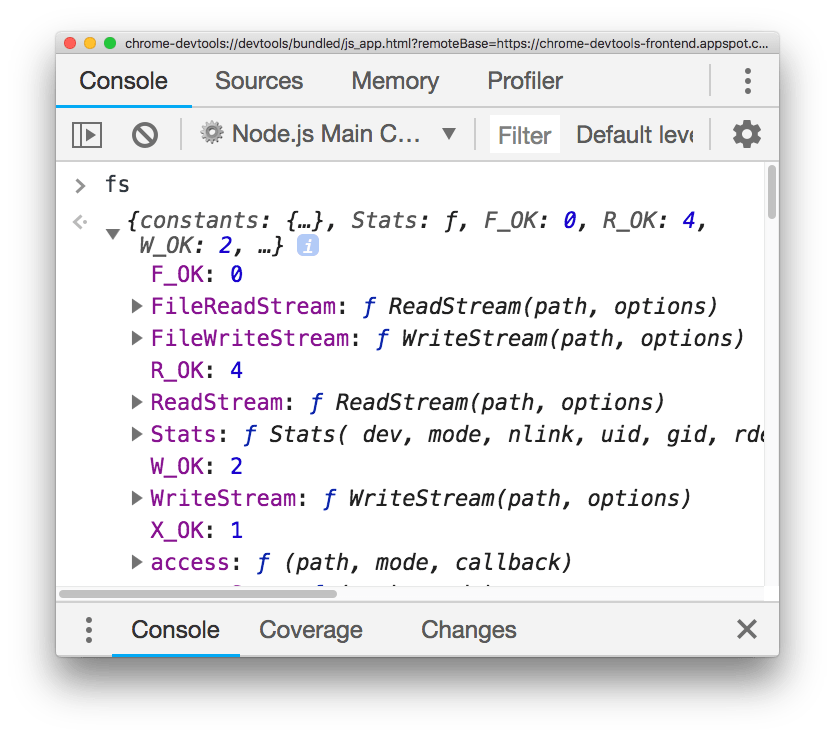
Click the Open dedicated DevTools for Node link next to the Node target, and you’ll have access to Node.js in the browser DevTools:
Make sure you click that, and not the inspect link down below, as it tool auto-reconnects to the Node.js instance when we restart it - pretty handy!
If the question is why we want to do that, it’s pretty simple: there’s no better way to debug any JavaScript code than using the DevTools and their tools. We have access to the profiler, all the stack visualization information, the code navigation facilities, a very cool debugger and much more!
Here is how can I help you:
- COURSES where I teach everything I know
- CODING BOOTCAMP cohort course - next edition in 2025
- BOOKS 16 coding ebooks you can download for free on JS Python C PHP and lots more
- Follow me on X